FxGlobalHub: Best Indicator For Forex Trading: Using RSI in Forex Trading
Updated: 2025/03/13 17:07:14
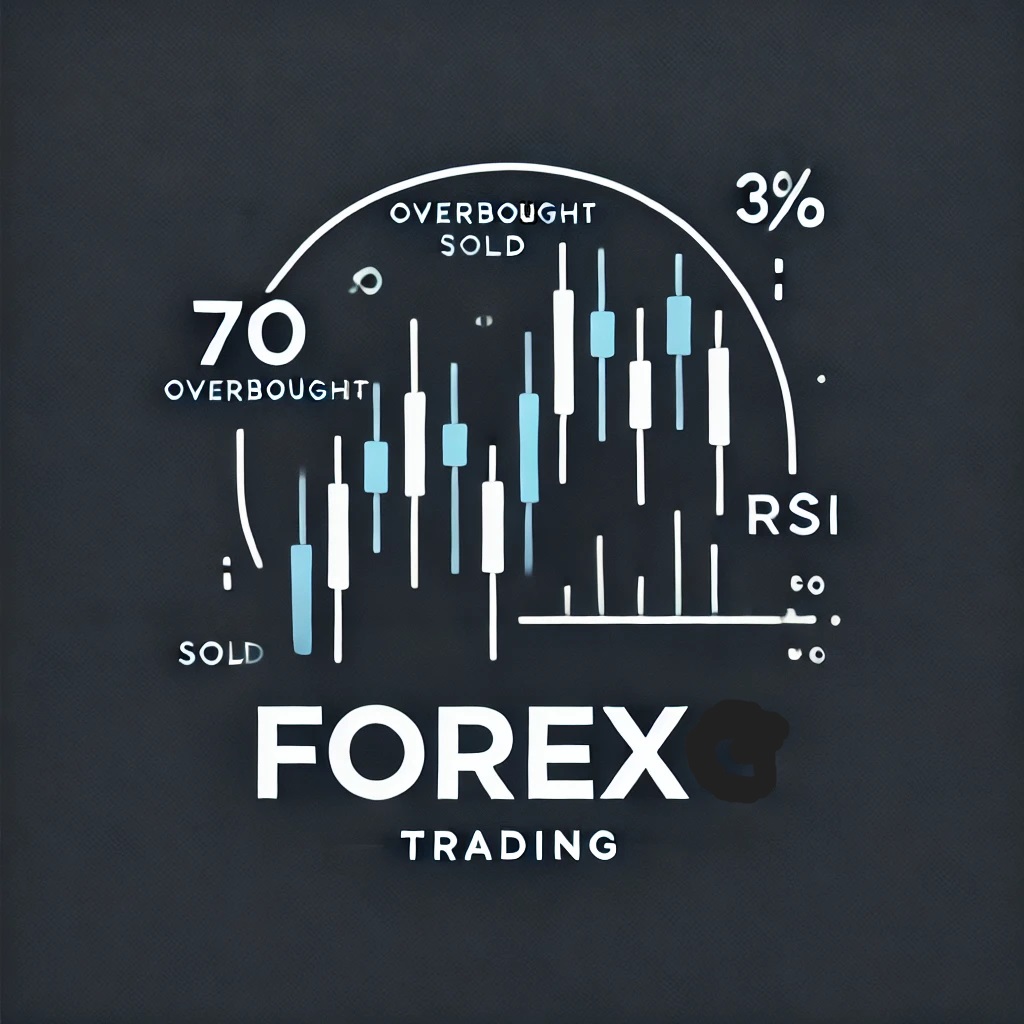
Best Indicator For Forex Trading: Use RSI to spot overbought (>70) and oversold (<30) zones for better Forex trades. It helps identify entry/exit points and set stop-losses. Combine RSI with MACD, ADX to filter false signals. While RSI doesn’t predict trends, it’s a key intraday tool for smarter, more strategic trading decisions.
The relative strength index (RSI) is most commonly used to indicate temporarily overbought or oversold conditions in a market. An intraday forex trading strategy can be devised to take advantage of indications from the RSI that a market is overextended and therefore likely to retrace.

Understanding the RSI
The RSI is a widely used technical indicator and an oscillator that indicates a market is overbought when the RSI value is over 70 and indicates oversold conditions when RSI readings are under 30. Some traders and analysts prefer to use the more extreme readings of 80 and 20.
A weakness of the RSI is that sudden, sharp price movements can cause it to spike repeatedly up or down, and, thus, it is prone to giving false signals. However, if those spikes or falls show a trading confirmation when compared with other signals, it could signal an entry or exit point.
It is not uncommon for the price to continue to extend well beyond the point where the RSI first indicates the market as being overbought or oversold. For this reason, a trading strategy using the RSI works best when supplemented with other technical indicators to avoid entering a trade too early.
Identifying Trading Setups Using the RSI
Here are some steps to implementing an intraday forex trading strategy that employs the RSI and at least one additional confirming indicator:
• Monitor the RSI for readings indicating the market is overbought or oversold.
• Consult other momentum or trend indicators for confirming signs of an impending retracement. For example, if the RSI shows oversold readings, a retracement to the upside is anticipated though not necessarily confirmed.
It is considered good practice to look at initiating a trade looking to profit from a retracement if one of these additional conditions are met:
• The moving average convergence divergence (MACD) has shown divergence from price (for example, if the price has made a new low, but the MACD has not and has turned from a downslope to an upslope).
• The average directional index (ADX) has turned in the direction of a possible retracement.
If the above conditions are met, then consider initiating the trade with a stop-loss order just beyond the recent low or high price, depending on whether the trade is a buy trade or sell trade, respectively. The initial profit target can be the nearest identified support/resistance level.
How Do You Calculate the Relative Strength Index (RSI)?
To calculate the RSI, you must first determine a time frame: one week, two weeks, and so on. From there, you have to sum the average gains and divide the value by the sum of the average losses. This value is the RSI.
What Is a Good RSI Index?
There is not specifically a "good" RSI index. RSI values are indicators that help traders make decisions depending on their goals. RSI values below 30 usually indicate buy signals whereas values above 70 generate sell signals.
What Is a Better Indicator Than RSI?
Different indicators provide different insights. RSI provides insight into overbought or oversold assets. It is not very helpful in identifying trends. The moving average convergence divergence (MACD) indicator is better suited for that.
The Bottom Line
The RSI helps traders understand when a market is overbought or oversold so that they can expect either momentum or a pullback in prices.
If the RSI, along with other indicators, is set up and read correctly, it can help technical traders determine their trading strategies, such as entry and exit points, buying or holding, or shorting positions. RSI can be used in a variety of markets, including stocks and forex.
US-China Trade Talks Resume: Gold & Forex Under Pressure?
2025/05/10 19:35:29

Trump's Deportation Order: Will Gold & Forex Markets Tremble?
2025/05/10 09:17:49

Trump's Greenland 'Free Association' Proposal: Gold & Forex Market Impact Analysis
2025/05/10 00:55:08

US Oil & Gas Rig Count Drops: Will Gold & Forex Markets Feel the Heat?
2025/05/10 00:02:30

Gold Futures Soar to $3,350: Is This the New Normal?
2025/05/09 22:39:19

US-UK Pharma Tariff Deal: A Golden Opportunity or Currency Catalyst?
2025/05/09 19:32:31

Canadian Employment Boom: What's Next for Gold & Forex Markets?
2025/05/09 19:31:01

Trump Open to Tax Hikes for the Rich: Gold & Forex Markets Brace for Impact!
2025/05/09 18:47:23